The dataset table shows the results of the cancer type you chosen in TCGA , and the number of normal samples and primary tumor tissues are presented.
There are miRNAs, other sncRNAs and genes differentially expression between normal and tumor tissues, presenting by heatmaps and summary tables.
The number in the parenthesis() indicates the amount of miRNA, other sncRNAs, and genes.
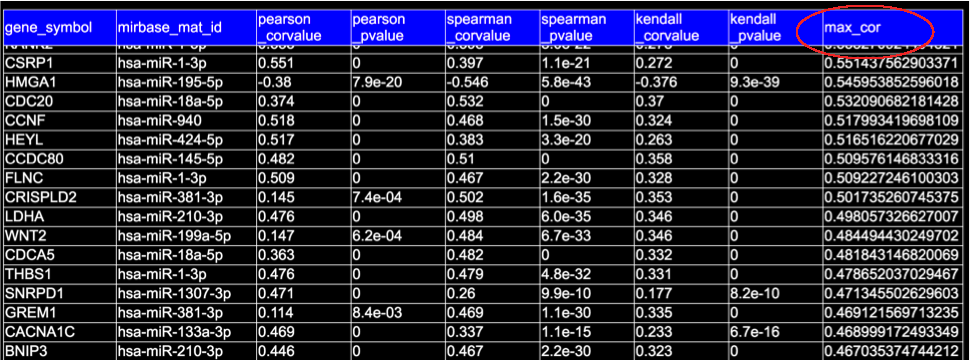
The maximum absolute correlation coefficient, the 'max_cor'/'max(|R|)' is the maximum of three correlation: the Pearson, Spearman, and Kendall correlations for each miRNA-gene pair.
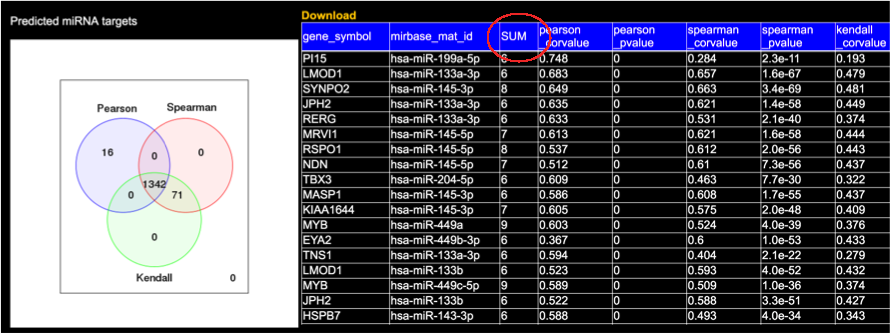
'The number of prediction tools' which indicate the ‘SUM’ in the table, can be chosen here. This function only works in the 'Predicted miRNA targets' section.
The correlations of each miRNA-gene pair between the differentially expressed miRNAs and genes were calculated and divided into three groups, namely, 'Validated', 'Predicated', and 'Without any evidence'.
The 'Validated' interactions are based on the information from miRTarBase database Release 6.1, which contains > 366,000 interactions.
The predicted miRNA targets were identified by 12 miRNA target prediction tools. Only the targets that were identified by at least 6 tools were retained to improve the reliability of the prediction results.
To illustrate the many-to-many relationships between miRNA-gene interactions, the Cytoscape Web tool is embedded for interactive network visualization.
The genes that interacted with miRNAs are further functionally analysed to address the cancer miRNA-related pathways.
'Validated' is the functional analysis from the 'Validated miRNA targets', showing above .
'Validated+Predicted' is the combination analysis of 'Validated miRNA targets' and 'Predicted miRNA targets'.
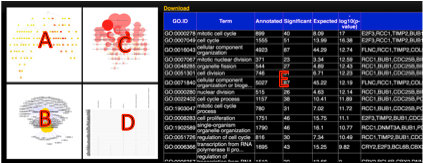
A, B: The topology of significantly altered GO categories accounted by topGO and GeneAnswers packages of Bioconductor, respectively.
C, D: The most significantly altered GO categories and genes.
E: A table of all significantly altered GO categories.
A, B: The topology of significantly altered GO categories accounted by topGO and GeneAnswers packages of Bioconductor, respectively.
C, D: The most significantly altered GO categories and genes.
E: A table of all significantly altered GO categories.
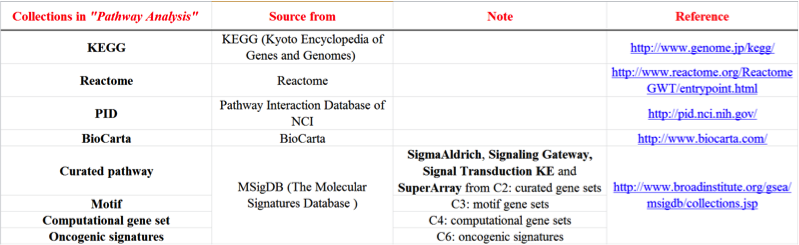
There are 8 collections of gene sets from public databases including
KEGG, REACTOME, MSigDB, PID, and Biocarta.
The following table shows the information of these collections.
There are 8 collections of gene sets from public databases including
KEGG, REACTOME, MSigDB, PID, and Biocarta.
The following table shows the information of these collections.